L2: Image processing and segmentation
The goal
Your goal in this exercise is to detect the ball being thrown towards the robot. Based on the knowledge gained in previous tasks, you have to prepare the script that will detect the flying ball and, if possible, calculate its trajectory in 2D (in pixels) or 3D (in meters). Sample robotic systems using similar algorithms can be seen on following movies.
Input data
As an input you will get some static images of the ball you are going to detect along with the calibration images for the camera that was used to record them. This data should be used to create the “model” of the ball.
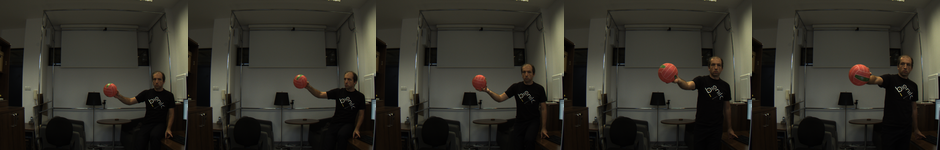
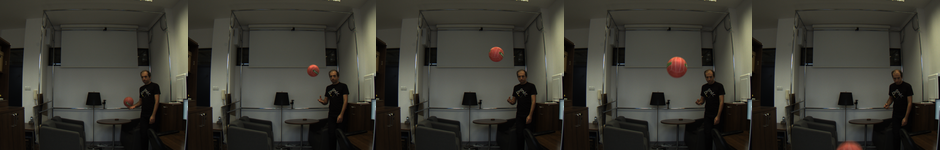
Based on the ball model you have to create an algorithm able to recognize this ball in the image sequence. On the sequence the ball will be moving with ballistic trajectory (you can treat the throw as a perfect parabolic motion).
Task advancement
Segmenting the ball [2p]
The most important thing is detection of the ball itself. Your algorithm must be able to detect the ball on both learning images and in testing sequences. Output of this step is the mask of the ball.
Calculating the ball parameters (image) [1p]
For the detected ball you have to calculate its parameters in the picture. You have to calculate at least:
- ball position (x, y)
- ball radius r
You can also calculate current velocity (vx, vy) in the image.
Calculating the ball parameters (world) [1p]
Based on the calculated pixel parameters and known camera model you have to calculate real world position (X, Y, Z) of the ball.
Trajectory estimation and prediction [1p]
Last step is to calculate the estimated trajectory of the ball (parabolic). For each frame you have to calculate the trajectory based on the all detection up so far. For the first few images the trajectory will be far from real one, but after short time predicted trajectory should be consistent with the real ball path. For this task it is enough to calculate the 2D trajectory based on the pixel positions of the ball.
Results visualization [1p]
Try to make the visualization of the results live as the pictures are processed. Final result should look similar to the one shown in the first movie, around 0:40:

Usefull functions
There are a lot of methods in the computer vision and image processing toolboxes. Some of them, that can be helpful in solving the task, are given below.
- Input image, after loading, will be encoded in RGB color space. For the color-based segmentation you will probably need to convert your image to HSV or YCbCr colorspace.
- You will definitely need some image filters. Those can be used to remove noise from the images.
- To remove small noise from the mask image (after segmentation) you can use image morphology fiters, especially opening and closing operators.
- To calculate the parameters of the selected segment use region properties. For example, to calculate the area of the segment use bwarea function.
- To fit the parabola to the given set of points you can use polyfit function.
- To visualize data you can use insertMarker or insertShape.